Profiling can provide real revelations.
Sometimes, you have that gut feeling that a certain code path is the performance bottleneck. Then you go ahead and fix that only to see, that the code is still slow.
This is when a profiler kicks in: It helps you determine the real bottlenecks, so you can start fixing them
The PHP IDE I’m currently using, Zend Studio (it’s the only PHP IDE filling my requirements on the Mac currently) does have a built-in profiler, but it’s a real bitch to set up.
You need to install some binary component into your web server. Then the IDE should be able to debug and profile your application.
Emphasis on “should”.
I got it to work once, but it broke soon after and I never really felt inclined to put more effort into this – even more so as I’m from time to time working with a snapshot version of PHP for which the provided binary component may not work at all.
There’s an open source solution that works much better both in terms of information you can get out of it and in terms of ease of setup and use.
It’s Xdebug.
On gentoo, installing is a matter of emerge dev-php5/xdebug and on other systems, pear install xdebug might do the trick.
Configuration is easy too.
Xdebug generates profiling information in the same format as valgrind, the incredible debugger the KDE people created.
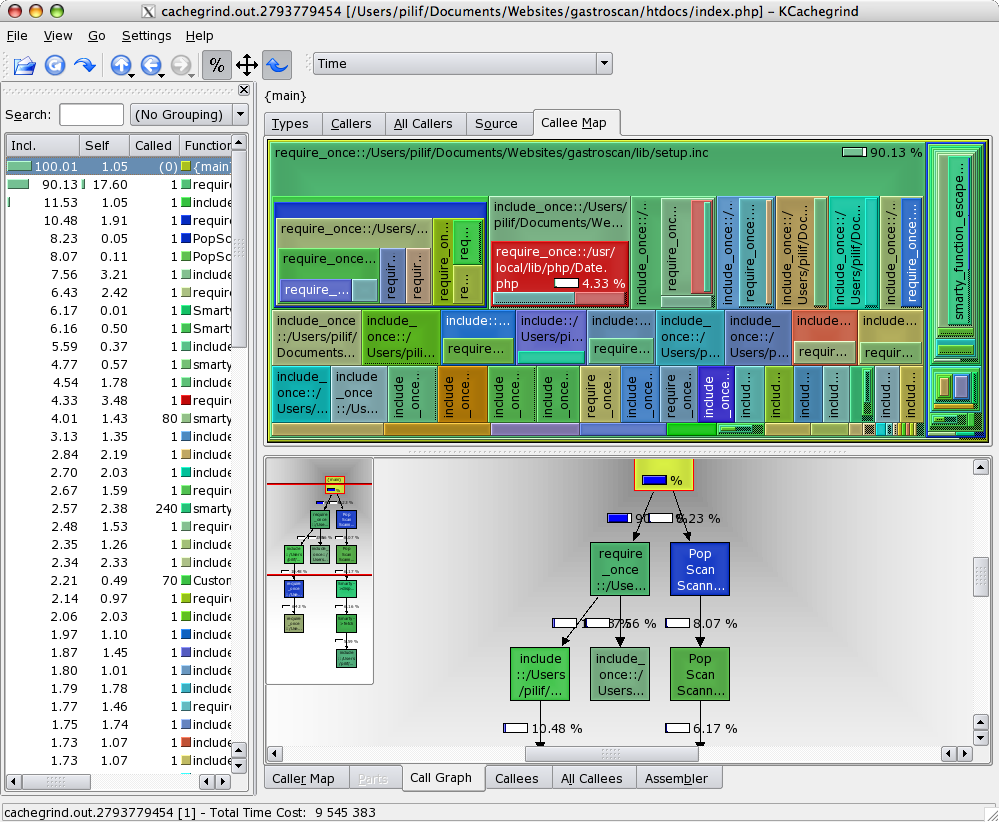
And once you have that profiling information, you can use a tool like KCacheGrind to evaluate the data you’ve collected.
The tool provides some incredibly useful views of your code, making finding performance problems a joyful experience.
Best of all though is that I was able to compile KCacheGrind along with its dependencies on my MacBook Pro – another big advantage of having a real UNIX backend on your desktop.
By the way: Xdebug also is a debugger for PHP, though I’ve never used it for that as I never felt the need to step through PHP code. Because you don’t have to compile it, you are often faster by instrumenting the code and just running the thing – especially once the code is spreading over a multitude of files.